Note
Go to the end to download the full example code. or to run this example in your browser via Binder
Rigid Motion Pattern Generation#
Example of rigid motion pattern generation.
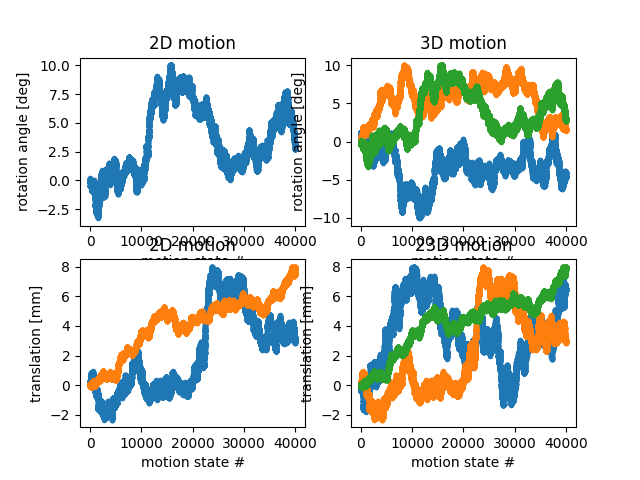
This examples show how to generate rigid motion pattern for 2D (in-plane rotation, x-y translation) and 3D (3D rotation, x-y-z translation) imaging problems.
import matplotlib.pyplot as plt
import numpy as np

from mrtwin import rigid_motion
Basic Usage#
Two- and three-dimensional rigid motion patterns
can be generated as follows, using nframes to
specify the number of motion states:
theta, dy2D, dx2D = rigid_motion(2, 200 * 200)
roll, pitch, yaw, dz3D, dy3D, dx3D = rigid_motion(3, 200 * 200)

fig1, ax1 = plt.subplots(2, 2)
ax1[0, 0].plot(theta, "."), ax1[0, 0].set(
    xlabel="motion state #", ylabel="rotation angle [deg]"
), ax1[0, 0].set_title("2D motion")
ax1[1, 0].plot(np.stack((dy2D, dx2D), axis=1), "."), ax1[1, 0].set(
    xlabel="motion state #", ylabel="translation [mm]"
), ax1[1, 0].set_title("2D motion")
ax1[0, 1].plot(np.stack((roll, pitch, yaw), axis=1), "."), ax1[0, 1].set(
    xlabel="motion state #", ylabel="rotation angle [deg]"
), ax1[0, 1].set_title("3D motion")
ax1[1, 1].plot(np.stack((dz3D, dy3D, dx3D), axis=1), "."), ax1[1, 1].set(
    xlabel="motion state #", ylabel="translation [mm]"
), ax1[1, 1].set_title("23D motion")
plt.show()

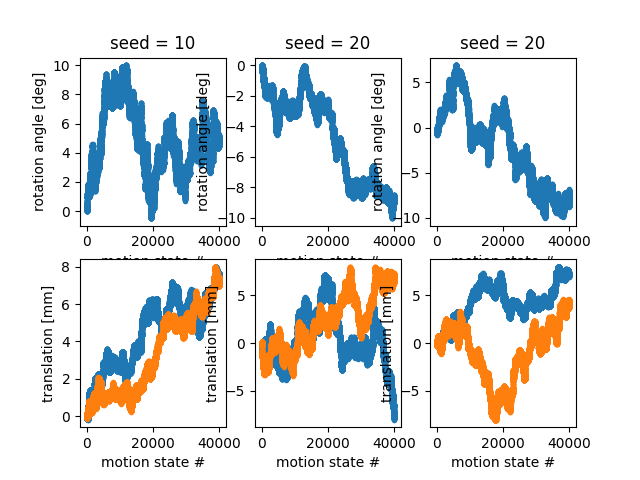
For reproducibility, the seed for random pattern generation is set to 42.
This can be changed via the seed argument:
theta1, dy1, dx1 = rigid_motion(2, 200 * 200, seed=10)
theta2, dy2, dx2 = rigid_motion(2, 200 * 200, seed=20)
theta3, dy3, dx3 = rigid_motion(2, 200 * 200, seed=30)

fig2, ax2 = plt.subplots(2, 3)
ax2[0, 0].plot(theta1, "."), ax2[0, 0].set(
    xlabel="motion state #", ylabel="rotation angle [deg]"
), ax2[0, 0].set_title("seed = 10")
ax2[1, 0].plot(np.stack((dy1, dx1), axis=1), "."), ax2[1, 0].set(
    xlabel="motion state #", ylabel="translation [mm]"
)
ax2[0, 1].plot(theta2, "."), ax2[0, 1].set(
    xlabel="motion state #", ylabel="rotation angle [deg]"
), ax2[0, 1].set_title("seed = 20")
ax2[1, 1].plot(np.stack((dy2, dx2), axis=1), "."), ax2[1, 1].set(
    xlabel="motion state #", ylabel="translation [mm]"
)
ax2[0, 2].plot(theta3, "."), ax2[0, 2].set(
    xlabel="motion state #", ylabel="rotation angle [deg]"
), ax2[0, 2].set_title("seed = 20")
ax2[1, 2].plot(np.stack((dy3, dx3), axis=1), "."), ax2[1, 2].set(
    xlabel="motion state #", ylabel="translation [mm]"
)
plt.show()

Advanced Usage#
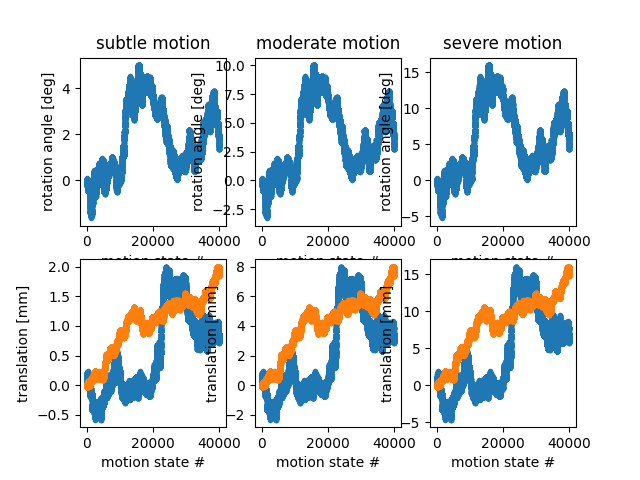
Severity of motion can be specified via the degree argument.
This can be a string - accepted values are "subtle", "moderate"
and "severe". These corresponds to the following motion ranges:
# * ``"subtle"``: maximum rotation ``5.0 [deg]``; maximum translation ``2.0 [mm]``
# * ``"moderate"``: maximum rotation ``10.0 [deg]``; maximum translation ``8.0 [mm]``
# * ``"severe"``: maximum rotation ``16.0 [deg]``; maximum translation ``16.0 [mm]`

theta1, dy1, dx1 = rigid_motion(2, 200 * 200, degree="subtle")
theta2, dy2, dx2 = rigid_motion(2, 200 * 200, degree="moderate")
theta3, dy3, dx3 = rigid_motion(2, 200 * 200, degree="severe")

fig3, ax3 = plt.subplots(2, 3)
ax3[0, 0].plot(theta1, "."), ax3[0, 0].set(
    xlabel="motion state #", ylabel="rotation angle [deg]"
), ax3[0, 0].set_title("subtle motion")
ax3[1, 0].plot(np.stack((dy1, dx1), axis=1), "."), ax3[1, 0].set(
    xlabel="motion state #", ylabel="translation [mm]"
)
ax3[0, 1].plot(theta2, "."), ax3[0, 1].set(
    xlabel="motion state #", ylabel="rotation angle [deg]"
), ax3[0, 1].set_title("moderate motion")
ax3[1, 1].plot(np.stack((dy2, dx2), axis=1), "."), ax3[1, 1].set(
    xlabel="motion state #", ylabel="translation [mm]"
)
ax3[0, 2].plot(theta3, "."), ax3[0, 2].set(
    xlabel="motion state #", ylabel="rotation angle [deg]"
), ax3[0, 2].set_title("severe motion")
ax3[1, 2].plot(np.stack((dy3, dx3), axis=1), "."), ax3[1, 2].set(
    xlabel="motion state #", ylabel="translation [mm]"
)
plt.show()

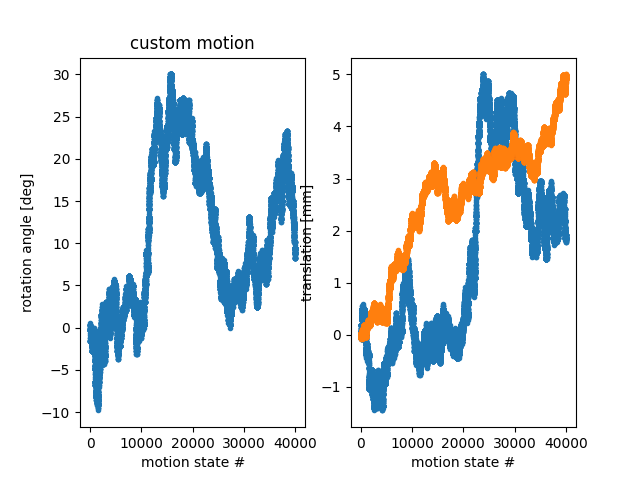
As an alternative, user can specify a tuple of floats, where degree[0]
is the maximum rotation in [deg] and degree[1] is the maximum translation
in [mm]:
theta1, dy1, dx1 = rigid_motion(2, 200 * 200, degree=(30, 5))

fig4, ax4 = plt.subplots(1, 2)
ax4[0].plot(theta1, "."), ax4[0].set(
    xlabel="motion state #", ylabel="rotation angle [deg]"
), ax4[0].set_title("custom motion")
ax4[1].plot(np.stack((dy1, dx1), axis=1), "."), ax4[1].set(
    xlabel="motion state #", ylabel="translation [mm]"
)
plt.show()

Total running time of the script: (0 minutes 4.159 seconds)